Performance Dashboards

CIP Dashboard


bottom feature image icon

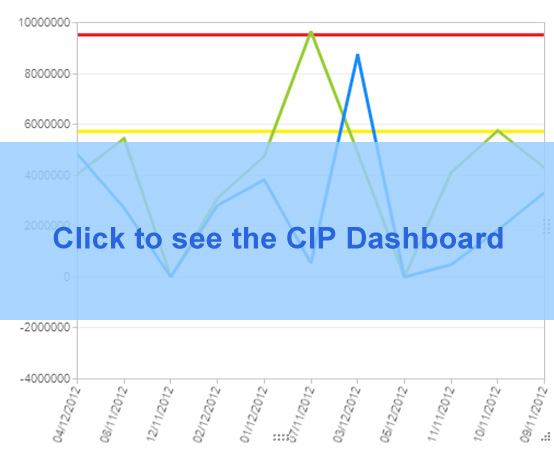
The Capital Improvement Project (CIP) Dashboard shows the amount of CIP funds encumbered (placed on contract) and expended (paid) by Department, by month. This allows citizens to see how the funds raised by bond issues are being spent, by whom, and when. This preliminary release of the dashboard will continue to evolve, with new features and visualizations as more data is added.

Live Now! Click to See

State Strategic Dashboard

bottom feature image icon

This dashboard shows how well the State Government is performing its missions. Activities are grouped into Lines of Business, each with its own set of performance metrics. This dashboard is under development and will be released in Fiscal Year 2013.

Coming in FY13

IT Dashboard

bottom feature image icon

This dashboard shows the status of each of the transformation projects (both business process reengineering and IT/IRM modernization) being managed by OIMT across the five dimensions of project management – cost, schedule, risk, performance, and scope. This dashboard is under development and will be released in Fiscal Year 2013.

Coming in FY13